Whether conducted online or onsite, these instructor-led live Prometheus training sessions provide interactive, hands-on experience in leveraging Prometheus for effective event monitoring and alerting.
Prometheus training is offered as either "online live training" or "onsite live training". The online live format (also known as "remote live training") utilizes an interactive remote desktop environment. Alternatively, onsite live training can be delivered directly at the client's premises in Plovdiv or at NobleProg's corporate training centers in Plovdiv.
NobleProg -- Your Local Training Provider
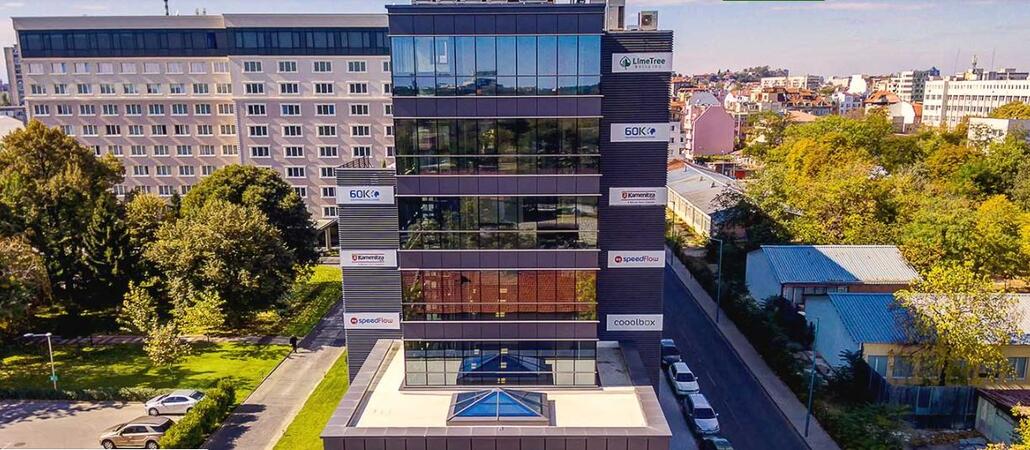
Business Center Plovdiv
Han Kubrat St 1, Plovdiv, Bulgaria, 4017
This is the most modern business center in the city, with all the necessary functionalities, while being located in a green part of the city.
It is about 20 minutes by bus from the main train station as well as the city center.
Instructor-led training in Plovdiv for advanced IT professionals to master Grafana and Prometheus integration. Participants will configure production setups, connect diverse data sources, build advanced dashboards with variables, and implement robust alerting systems within distributed environments.
This instructor-led, live training Plovdiv (online or onsite) is designed for advanced-level DevOps engineers and SREs who seek to effectively manage and scale Prometheus and Grafana in large-scale environments.
Upon completion of this training, participants will be able to:
Architect Prometheus and Grafana for large-scale and distributed environments.
Optimize Prometheus performance for high-traffic systems.
Configure Grafana for large datasets and complex visualizations.
Implement advanced troubleshooting and scalability strategies.
This instructor-led, live training in Plovdiv (online or onsite) is aimed at intermediate-level developers and DevOps engineers who wish to instrument their applications to export and monitor custom metrics effectively using Prometheus and Grafana.
By the end of this training, participants will be able to:
Understand the importance of custom metrics for application monitoring.
Instrument applications to export custom metrics for Prometheus.
Create and configure dashboards in Grafana to visualize custom metrics.
Apply best practices for integrating monitoring into the development lifecycle.
This instructor-led, live training in Plovdiv (online or onsite) is aimed at advanced-level Kubernetes administrators and DevOps engineers who wish to enhance their monitoring skills for Kubernetes clusters using Prometheus and Grafana.
By the end of this training, participants will be able to:
Set up Prometheus and Grafana for Kubernetes monitoring.
Monitor key metrics for pods, nodes, and services.
Create dynamic dashboards to visualize cluster health and performance.
Implement alerting strategies for proactive issue resolution.
Apply best practices for scaling monitoring solutions in Kubernetes environments.
This instructor-led, live training in Plovdiv (online or onsite) is designed for advanced-level DevOps and SRE professionals aiming to elevate their alerting and automation proficiency with Grafana and Prometheus.
Upon completion of this training, participants will be capable of:
Creating and administering advanced alerting rules in Prometheus.
Integrating Prometheus Alertmanager with external tools via webhooks.
Automating alert responses to expedite issue resolution.
Leveraging Grafana for effective visualization and management of alerts.
This instructor-led live training in Plovdiv (online or onsite) is aimed at intermediate-level cloud and DevOps engineers who wish to enhance cloud observability with Grafana and Prometheus.
By the end of this training, participants will be able to:
Understand the benefits of integrating Grafana and Prometheus with cloud platforms.
Set up Prometheus for monitoring cloud-based resources.
Configure Grafana for visualizing cloud service metrics.
Leverage cloud-native tools and integrations for monitoring scalability.
This live, instructor-led training Plovdiv (available online or onsite) is tailored for intermediate-level DevOps and SRE professionals seeking to create impactful dashboards and optimize their monitoring workflows using Grafana and Prometheus.
By the end of this training, participants will be able to:
Apply best practices for designing effective dashboards.
Create and configure sophisticated Grafana dashboard components.
Utilize Grafana templating to build dynamic and reusable dashboard structures.
Deploy alerting mechanisms to improve operational awareness.
This instructor-led, live training in Plovdiv (online or onsite) is aimed at beginner-level system administrators and DevOps engineers who wish to develop core monitoring skills using Grafana and Prometheus.
By the end of this training, participants will be able to:
Understand the purpose and importance of monitoring in IT environments.
Install and configure Grafana and Prometheus for basic monitoring tasks.
Create simple dashboards and alerts to visualize system performance.
Apply best practices for monitoring system availability and performance.
This instructor-led, live training in Plovdiv (online or onsite) targets beginner-level IT professionals and DevOps practitioners eager to learn the basics of Grafana and Prometheus.
By the end of this training, participants will be able to:
Understand the purpose and key features of Grafana and Prometheus.
Install and configure Grafana and Prometheus on a Linux environment.
Set up basic data sources and dashboards in Grafana.
Monitor system metrics and visualize data using Prometheus.
This instructor-led live training in Plovdiv (online or onsite) is tailored for system administrators and DevOps engineers who wish to leverage Prometheus for monitoring systems and applications, either natively or through highly dynamic microservices running in a cloud environment.
By the end of this training, participants will be able to:
Install and configure Prometheus.
Understand the features, architecture, and core concepts of Prometheus.
Learn how to query data using PromQL.
Build visualizations and dashboards with Grafana.
Configure systems monitoring and alerting rules.
Analyze and optimize systems and application performance.
Enable secure integration to remote endpoints and existing systems.
Read more...
Last Updated:
Testimonials (1)
Relax, easy no pressure to complete the assignment
Online Prometheus training in Plovdiv, Prometheus training courses in Plovdiv, Weekend Prometheus courses in Plovdiv, Evening Prometheus training in Plovdiv, Prometheus instructor-led in Plovdiv, Prometheus classes in Plovdiv, Prometheus coaching in Plovdiv, Evening Prometheus courses in Plovdiv, Prometheus trainer in Plovdiv, Online Prometheus training in Plovdiv, Prometheus one on one training in Plovdiv, Weekend Prometheus training in Plovdiv, Prometheus on-site in Plovdiv, Prometheus instructor in Plovdiv, Prometheus instructor-led in Plovdiv, Prometheus private courses in Plovdiv, Prometheus boot camp in Plovdiv